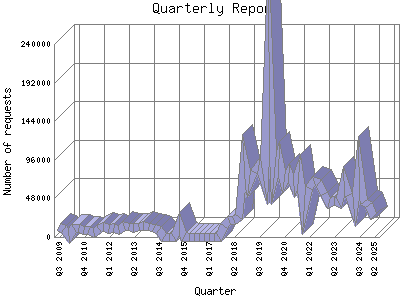
The Quarterly Report shows total activity on your site for each quarter of a
year. Remember that each page hit can result in several server requests as the
images for each page are loaded.
Note: Most likely, the first and
last quarters will not represent a complete quarter's worth of data, resulting
in lower hits.
| Quarter | Number of requests | Percentage of the requests | |
|---|---|---|---|
| 1. | Q1 2026 | 36,243 | 1.49% |
| 2. | Q4 2025 | 106,877 | 4.38% |
| 3. | Q3 2025 | 104,531 | 4.28% |
| 4. | Q2 2025 | 49,674 | 2.3% |
| 5. | Q1 2025 | 39,919 | 1.63% |
| 6. | Q4 2024 | 43,819 | 1.80% |
| 7. | Q3 2024 | 86,569 | 3.54% |
| 8. | Q2 2024 | 34,426 | 1.40% |
| 9. | Q1 2024 | 51,687 | 2.11% |
| 10. | Q4 2023 | 70,126 | 2.87% |
| 11. | Q3 2023 | 41,794 | 1.70% |
| 12. | Q2 2023 | 45,230 | 1.86% |
| 13. | Q1 2023 | 42,394 | 1.73% |
| 14. | Q4 2022 | 53,366 | 2.19% |
| 15. | Q3 2022 | 66,854 | 2.73% |
| 16. | Q2 2022 | 69,116 | 2.82% |
| 17. | Q1 2022 | 61,201 | 2.50% |
| 18. | Q4 2021 | 32,778 | 1.34% |
| 19. | Q3 2021 | 80,355 | 3.29% |
| 20. | Q2 2021 | 62,913 | 2.58% |
| 21. | Q1 2021 | 80,112 | 3.28% |
| 22. | Q4 2020 | 68,099 | 2.79% |
| 23. | Q3 2020 | 97,502 | 3.99% |
| 24. | Q2 2020 | 73,190 | 2.100% |
| 25. | Q1 2020 | 230,540 | 9.42% |
| 26. | Q4 2019 | 69,329 | 2.83% |
| 27. | Q3 2019 | 89,137 | 3.64% |
| 28. | Q2 2019 | 80,601 | 3.30% |
| 29. | Q1 2019 | 65,889 | 2.70% |
| 30. | Q4 2018 | 93,969 | 3.84% |
| 31. | Q3 2018 | 25,315 | 1.3% |
| 32. | Q2 2018 | 20,652 | 0.84% |
| 33. | Q1 2018 | 21,189 | 0.87% |
| 34. | Q4 2017 | 13,834 | 0.57% |
| 35. | Q3 2017 | 0 | 0% |
| 36. | Q2 2017 | 0 | 0% |
| 37. | Q1 2017 | 0 | 0% |
| 38. | Q4 2016 | 0 | 0% |
| 39. | Q3 2016 | 0 | 0% |
| 40. | Q2 2016 | 0 | 0% |
| 41. | Q1 2016 | 0 | 0% |
| 42. | Q4 2015 | 0 | 0% |
| 43. | Q3 2015 | 16,260 | 0.67% |
| 44. | Q2 2015 | 0 | 0% |
| 45. | Q1 2015 | 0 | 0% |
| 46. | Q4 2014 | 0 | 0% |
| 47. | Q3 2014 | 8,942 | 0.37% |
| 48. | Q2 2014 | 11,625 | 0.48% |
| 49. | Q1 2014 | 11,819 | 0.49% |
| 50. | Q4 2013 | 13,837 | 0.57% |
| 51. | Q3 2013 | 12,030 | 0.50% |
| 52. | Q2 2013 | 11,643 | 0.48% |
| 53. | Q1 2013 | 12,946 | 0.52% |
| 54. | Q4 2012 | 13,945 | 0.58% |
| 55. | Q3 2012 | 8,191 | 0.33% |
| 56. | Q2 2012 | 11,567 | 0.48% |
| 57. | Q1 2012 | 10,437 | 0.42% |
| 58. | Q4 2011 | 12,331 | 0.50% |
| 59. | Q3 2011 | 10,334 | 0.42% |
| 60. | Q2 2011 | 5,492 | 0.22% |
| 61. | Q1 2011 | 8,400 | 0.34% |
| 62. | Q4 2010 | 9,058 | 0.38% |
| 63. | Q3 2010 | 11,411 | 0.47% |
| 64. | Q2 2010 | 10,901 | 0.44% |
| 65. | Q1 2010 | 1,718 | 0.8% |
| 66. | Q4 2009 | 10,254 | 0.41% |
| 67. | Q3 2009 | 12,580 | 0.51% |
Most active quarter Q1 2020 : 230,540 requests handled.
Quarterly average: 43659 requests handled.
This report was generated on February 22, 2026 06:02.
Report time frame July 9, 2009 10:20 to February 20, 2026 23:59.
| Web statistics report produced by: | |
 Analog 5.24 Analog 5.24 |  Report Magic for Analog 2.13 Report Magic for Analog 2.13 |